
TL;DR (30-second version)
TREE NEWS reports: This week BTC pulled back about 8% from the $86,000–$87,000 zone, yet there is almost no trace of panic on-chain: aggressive selling volume did not expand during the decline, and the hourly peak in realized losses was less than half that of the previous pullback.
The order book sends the same signal: as price fell to around $83,000, bid depth rose to recent highs, and aggressive buying during the decline increased rather than faded.
Coins are “moving house”: since late September, exchange balances have fallen by roughly 55,000 BTC, while addresses holding 1,000 to 10,000 BTC accumulated about 50,000 BTC over the same period, matching the timing of the cost-basis cluster forming at $83,000–$84,000.
But momentum is indeed slowing: single-day ETF inflows have dropped to about one-eighth of their peak, total volume is near its lowest since ETFs launched, and the sell wall at $85,000–$85,500 remains unbroken.
Implied volatility has compressed below 35% once again — the 7th time in nearly five years. It signals the magnitude of volatility, not its direction.
In one sentence: the decline drew no panic, the rally drew no FOMO, and the market is quietly waiting between the two moods.
I. Background: Five Weeks Beneath the Wall
The previous weekly was written in early September, when BTC had just finished an August rally ignited by Treasury repo policy and stalled beneath the long-term holder cost-basis wall at $83,000–$86,000. The main storyline of the following five weeks was how that wall was touched, broken through, and then blocked again.
In mid-September, the Fed resumed rate hikes, and the 10-year Treasury yield climbed to around 5.2%, the highest since 2008. This should have been a boulder pressing down on risk assets, but Bitcoin did not retreat to its summer range. On September 21–22, U.S. spot ETFs recorded roughly $1 billion in net inflows on two consecutive days, with the first day marking the largest single-day inflow in nearly a year. Price then crossed the dense $84,000–$85,000 zone and pushed above $87,000 for the first time.
The resistance zone we had marked was genuinely traversed.
But breaking through is not the same as holding. ETF inflows then shrank day by day, falling to $24 million by September 28; on the Binance spot order book, a sell wall appeared around $85,000–$85,500 and tripled in size within a week. Price entered the lower half of that wall several times but never managed to break through.
Figure 1: The Sell Wall Above
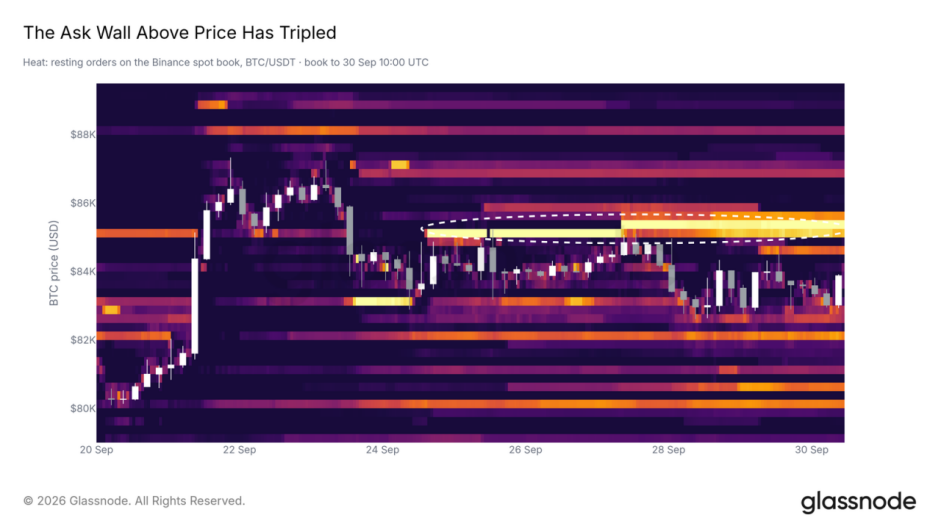
The bright horizontal band indicates areas of concentrated orders, with the dashed circle marking the sell side around $85,000–$85,500. Order book snapshot as of 2026-09-30 10:00 UTC, for illustrating the resistance structure in the background section only.
Source: Glassnode, from “1004 Strong Momentum Meets a Resistance Wall” (October 4, 2026). Data reflects the original analysis time, not the Week 41 weekend update.
Meanwhile, the lower cost lines were firmly underfoot: the short-term holder cost basis has shifted from the $69,000 we repeatedly mentioned to $73,000–$75,000, and the average active investor purchase price — the true market mean — sits at $77,200. The June 2026 low also became the first bear-market low since 2017 where the daily close never broke below realized price. Discussion of the bottom zone is gradually giving way to discussion of overhead resistance.
II. The Anomaly in the Pullback: Nobody’s Complaining
This week, that setup faced its first stress test. On October 6, Bitcoin briefly climbed above $86,000 twice before turning down, ultimately pulling back about 8% by the weekend. By the conventions of recent months, such a drop would be enough to tighten market sentiment again. In June 2026, with listed companies reducing holdings and geopolitical conflicts piling up, price briefly fell below $60,000 and collective pessimism was written on almost every chart. But this time, from on-chain data to the order book, the decline was eerily quiet.
First, aggressive selling volume. Aggressive selling refers to sell orders executed immediately at market price — whoever is willing to sell without regard to price is the most anxious. During this week’s decline, aggressive selling volume on major spot exchanges did not expand noticeably, running almost flat with the level seen when price fell to $75,000 on September 16. More intriguing is a longer-term shift: before August this year, every decline was accompanied by a spike in aggressive selling; after August, selling volume only expands noticeably during rallies, while declines are unremarkable.
Holders’ mindset seems to have quietly shifted around this juncture.
Next, the pace of loss realization. In the September 14–15 pullback, the network-wide hourly peak in realized losses reached $5.3 million; on September 23–24, a pullback of similar magnitude generated only $2.4 million — less than half — and this time the starting point was higher, at $87,000. By common logic, a higher starting point means more fear of heights and should produce larger swings on the way down, yet the data says the opposite.
Finally, the order book. Within 5% of the mid price, the excess of Binance spot bids over asks rose to a peak of about $80 million as price fell to around $83,000 — higher than during the September 10–16 pullback and roughly on par with July, when price consolidated at the bottom. At $83,000, this means the zone from $83,000 down to about $79,000 is filled with bids waiting to absorb supply.
At the same time, the net difference between aggressive buying and aggressive selling rose during the decline: some placed orders below to wait, while others hit the bid directly on the way down.
It must be emphasized that orders can be canceled at any time — they reflect intent, not a guarantee. But the three datasets point to the same conclusion: there is no trace of panic exit in this pullback. A decline is the best test of conviction’s quality; everyone is optimistic when prices rise, and only when unrealized gains shrink does true mindset get exposed. When more and more people stop being afraid, declines naturally become shallower.
III. 55,000 BTC “Moved House”
If selling pressure is light, where did the coins go? This week’s most noteworthy data point is a set of “moving house” figures.
Since price first spiked to $87,000 on September 21, exchange BTC balances have fallen by about 55,000 coins. Over the same period, addresses holding over 100,000 and those holding 10,000–100,000 collectively decreased by about 55,000 coins, while addresses holding 1,000–10,000 increased by about 50,000 coins — the two sides almost perfectly offsetting each other.
In other words, someone withdrew about 50,000 BTC from exchanges and large custody wallets into thousand-coin addresses, while price remained stable between $83,000–$85,000.
This is corroborated by changes in the cost-basis distribution chart. In just seven days from September 22–29, the $83,000–$84,000 zone added nearly 400,000 coins, of which about 370,000 came from other price ranges; meanwhile, the block that had accumulated at $62,000–$63,000 for six full months decreased by only 30,000 coins, barely participating in this long-short battle.
By October 3, the two cost-basis bars at $83,000–$84,000 totaled about 1.52 million coins, comparable to the 1.68 million coins at $62,000–$63,000 on August 1.
There is a detail here that was nearly misread. On September 27–28, the balance of entities holding over 100,000 coins suddenly dropped sharply — over 40,000 coins in one day, over 20,000 the next — and was briefly interpreted as “old whales distributing to new investors.” But a closer breakdown shows these coins’ age is highly concentrated at 1–2 years, with concentrated behavior and enormous scale, more like internal reorganization within the same set of cold wallets. Its characteristics closely overlap with ETF custodians and top-exchange cold wallets.
Therefore, this publication leans toward viewing this as not a typical whale distribution; thousand- to ten-thousand-coin self-custody addresses are currently the group closest to true whales and allocation-style capital, and coins are shifting toward them.
However, another set of metrics reminds us not to look at only one side. In the week ending September 29, long-term holders (coins held over 155 days) realized profits nearly doubled compared with the week of the breakout, with their share of total realized profits rising from 34% to 55%. Old holders are both taking profits into strength and being absorbed by allocation-style capital — this is not contradictory; it precisely describes the structure of this rally. Still, the overall scale of realization remains far below the levels seen at the 2024–2025 tops.
Figure 2: Historical Comparison of Profit-Taking
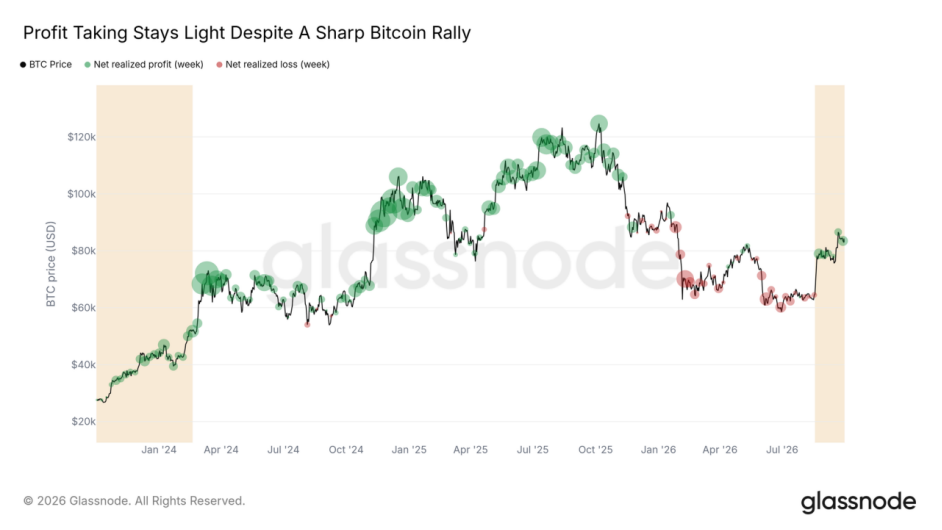
The black line is BTC price; green and red bubbles represent weekly net realized profit and loss respectively, with bubble size reflecting scale. This chart is for comparing overall realization intensity and does not separately show the long-term holders’ 55% profit share.
Source: Glassnode, from “1004 Strong Momentum Meets a Resistance Wall” (October 4, 2026). Data reflects the original analysis time, not the Week 41 weekend update.
IV. This Week’s Methodology: One Cost-Basis Bar — Turnover or Moving House?
The cost-basis distribution chart is a powerful tool for observing supply and demand, but it has an easily overlooked trap: it records cost by “the price at which the coin last moved,” so internal reorganization of custody wallets also leaves a towering bar on the chart. Previously, a large bar of about 550,000 coins appeared at $83,000–$84,000, later confirmed to be a trace of Coinbase wallet reorganization; whereas the accumulation at $62,000–$63,000 was genuine supply-demand turnover.
How to tell them apart? This publication suggests testing with three questions. First, is there a corresponding cross-group balance change: genuine turnover always comes with a simultaneous increase in holdings by a buyer group. Second, is the coin age and source highly consistent: a whole block moving with the same batch and same age is most likely wallet reorganization. Third, does price react to it: coins formed by genuine turnover tend to become a support zone on pullbacks.
This habit can be extended to any data: when you see a striking number, first ask how it was generated, then ask what it means.
V. The Other Side of Momentum: A Quiet Decline Is Not a Strong Rally
Having covered the good side, we must also look at the cold side.
ETF buying is cooling. After roughly $1 billion in net inflows on September 21 and 22, each trading day saw shrinkage, down to just $24 million by September 28; this week, October 6 recorded net inflows of about $119 million — only about one-eighth of the peak. Although year-to-date cumulative net inflows remain positive at over $1.25 billion, the climax of that buying wave has clearly passed.
Volume is similarly light: combined average daily volume across spot exchanges and ETFs is about $6.4 billion, still near the bottom of the range since ETFs launched. This means the current rally is still early-stage and carries a strong speculative character, with broad demand yet to truly enter.
Figure 3: ETF Net Inflows Cool After the Peak
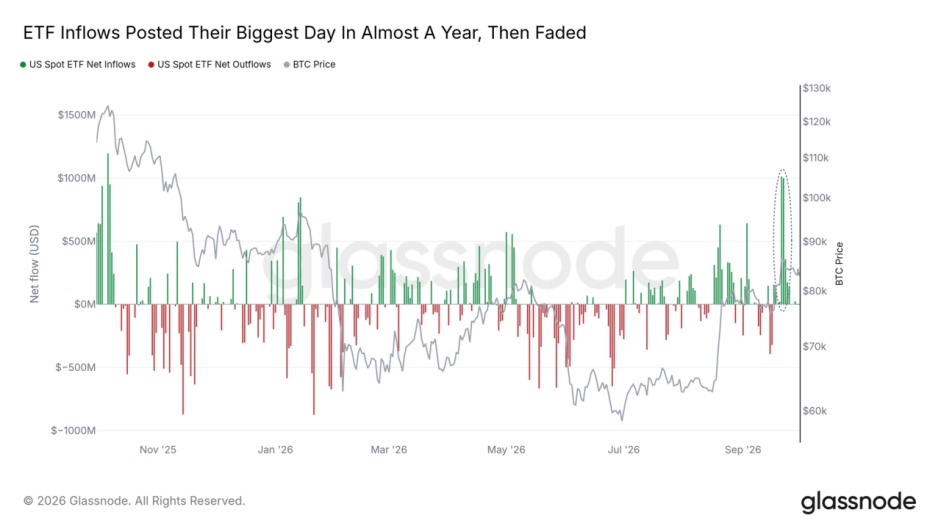
Green bars are U.S. spot ETF net inflows, red bars are net outflows, and the gray line is BTC price. The right side circles the late-September inflow peak and subsequent weakening; this chart does not cover the October 6 data mentioned in the text.
Source: Glassnode, from “1004 Strong Momentum Meets a Resistance Wall” (October 4, 2026). Data reflects the original analysis time, not the Week 41 weekend update.
Figure 4: Historical Comparison of Trading Activity
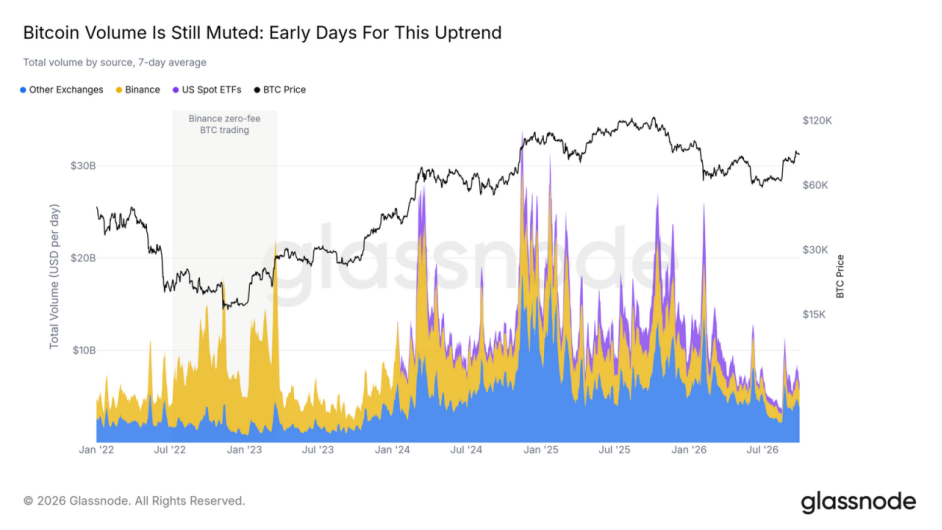
Stacked areas show volume from other exchanges, Binance, and U.S. spot ETFs, using a 7-day average. Observe the difference between the right-end volume and the active phase of 2024–2025.
Source: Glassnode, from “1004 Strong Momentum Meets a Resistance Wall” (October 4, 2026). Data reflects the original analysis time, not the Week 41 weekend update.
From a capital-flow perspective, the current position also deserves attention. Net inflows into realized market cap can be roughly divided into three stages: first, capital shifts from heavy outflow to slowing outflow; second, it turns to net inflow and the first rally begins; third, capital remains in net inflow but diverges from price. The market is currently in the third stage. After this structure played out in 2023, a deep pullback followed that reached all the way to the short-term holder cost basis — though at that time it was compounded by external shocks such as hawkish rate expectations and the collapse of crypto-friendly banks.
This time, the pullback began only after two divergences appeared, and with capital still in net inflow during an 8% pullback, the performance is slightly stronger than in 2023.
It should be noted that divergence itself is not a sell signal; it measures momentum decay: as long as divergence persists, momentum weakens further until the next, stronger wave of inflows breaks it. Comparing the August and September rallies, the second was clearly weaker than the first, and liquidity between long- and short-term holders is weakening. If this trend continues, each step upward from $85,000 may take longer than it did in August.
As for whether the short-term holder cost line will move up slowly, trading time for space, or be retouched by a pullback — both scenarios are currently possible.
VI. The Turning-Point Window: Low Volatility and Coin Concentration
At the same time, two volatility-related signals have stacked together.
First, 1-month at-the-money implied volatility has fallen below 35% again. Over the past five years, this has occurred 6 times: early January 2023, August–October 2023, August–September 2025, January 2026, May 2026, and August 2026. Each time it appeared just before a key market juncture — sometimes the first leg up after a decline, sometimes the first leg down after a rally.
After the most recent four occurrences, the DVOL volatility index rose by 75%, 133%, 61%, and 40% respectively. This is the 7th time.
Second, coin concentration within 5% of spot price has risen to 12%. On August 1, this figure was 12.9% — and no one expected that just 17 days later, price would surge from around $60,000 to $80,000 in one go. Of course, history does not simply repeat, and neither coin concentration nor implied volatility indicates direction; they only show that the more crowded the coins and the calmer the pricing, the more likely a violent move will be used to complete redistribution.
VII. A Longer Perspective: The Locked Half
Pulling the view from one week to one cycle, another set of data deserves to be placed here.
U.S. spot ETFs hold 1.292 million BTC, corporate entities hold 1.298 million, governments hold 619,000, and BTC held over 5 years totals 6.929 million. Together, these four categories amount to about 10.138 million coins, roughly 51% of current circulating supply. Of that, the portion held over 5 years accounts for only 5.39% of network-wide realized value, barely participating in market turnover, and includes Satoshi-era early coins and possibly permanently lost coins.
This does not mean these BTC will never be sold: ETF shares can be redeemed, and government holdings could theoretically be disposed of. But it illustrates one thing: the nominal 21 million cap does not equal the supply actually circulating in the market, and the effective float may be far below that number. As time passes, more BTC is shifting from “trading chips” to “reserve assets” — a slow but clear undercurrent of this cycle.
VIII. Coordinates and Conclusions
Pinning the position on the chart, from top to bottom:
$85,000–$85,500: Binance spot sell wall, currently the nearest overhead resistance. A high-volume hold above it would clear the largest block of order-book resistance.
$84,000: Previously viewed as a key level to defend, now slightly broken — whether it can be reclaimed is worth watching.
$83,000–$84,000: Where the new cost-basis peak and bid wall sit — the first support zone on a pullback.
$77,200: The true market mean; a daily close back below it would end this strong range.
$73,000–$75,000: Short-term holder cost basis, the breakeven line for recent buyers.
$62,000–$65,000: The accumulation bottom formed during summer consolidation.
Figure 5: Price and the Two Holder Cost Lines
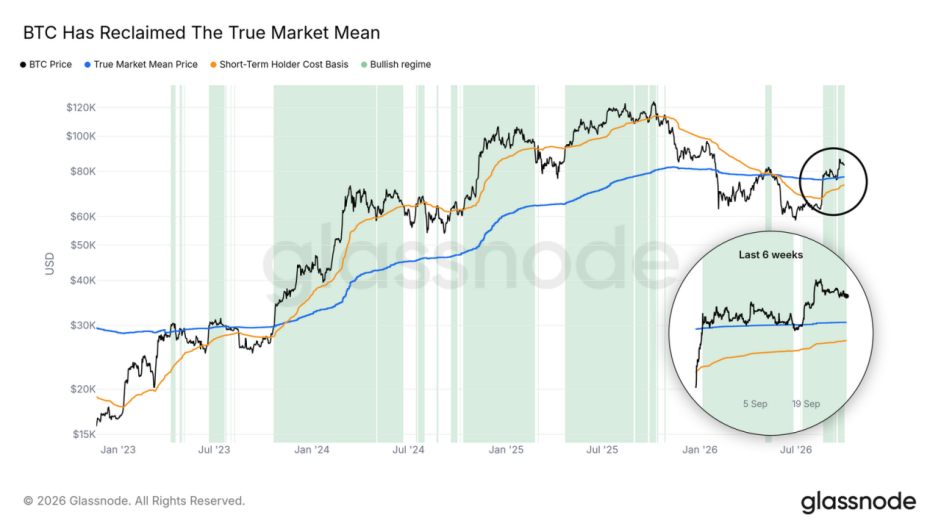
The black line is BTC price, the blue line is the true market mean, and the orange line is the short-term holder cost basis; the bottom-right inset zooms in on the recent position. This chart corresponds to the two cost lines in this section and does not display all six price coordinates.
Source: Glassnode, from “1004 Strong Momentum Meets a Resistance Wall” (October 4, 2026). Data reflects the original analysis time, not the Week 41 weekend update.
The anchors for judgment are equally clear. If price crosses the sell wall on expanding volume and ETF inflows return to near September 21 levels, it would confirm the rally is gaining broader participation; conversely, if long-term holders increase selling during consolidation, or price closes below $77,200 on a daily basis, it would weaken the current strong structure.
Back to this week. An 8% pullback would have been headline-worthy at any point last year, yet this time there is almost no sound of panic in the data; at the same time, the overhead sell wall, light volume, and weakening ETF buying also remind us: not panicking on the way down does not equal having conviction on the way up. The market right now is like a person pausing at the edge of a step — not retreating, but not yet stepping up.
Direction is not determined by any single indicator, and certainly not by us. On-chain data can tell you where the cycle stands and where the coordinates are; as for when to act, how much to allocate, and where to admit you’re wrong — the answer isn’t on-chain, it’s in your own trading plan.
Data and some views in this article are compiled from on-chain analyst Murphy (@Murphychen888)’s public analysis from late September to October 10, 2026, as well as Glassnode on-chain weeklies dated September 6, September 13, September 27, and October 4, 2026. ETF flow data comes from public media reports. The judgments herein are this publication’s synthesis and are for information sharing only — not investment advice.