
TREE NEWS reports: Tree News · On-chain Analysis | 2026 Week 43 Interim Observation | October 19–25, as of October 21
Bitcoin keeps probing around $80,000, and the question the market cares about most is often the same one: next time, will it go up or down?
But when recent on-chain behavior is viewed together, what’s more noteworthy is a shift: the coins willing to exit during declines are decreasing, yet new buying that is willing to keep chasing prices has not clearly picked up.
This explains why the market doesn’t look as panicked anymore, yet rebounds always lack follow-through.
Lighter selling pressure has bought time for price; to break out of the range, demand still needs to provide the answer.
This article uses information available as of October 21 as its observation boundary. The Glassnode Week 43 update published on October 19 serves as the reference for this week’s state; earlier on-chain charts are used to illustrate how the situation formed and are not treated as real-time snapshots from October 21.
Understand This Issue in 30 Seconds
The supply side is improving: Long-term holders’ loss realization has fallen significantly from earlier peaks, and the scale of losses during repeated retests has not continued to expand.
Position changes remain divided: New buyers’ holdings have increased, and some mid-sized holder groups added positions during pullbacks; this can coexist with insufficient willingness to chase prices in spot markets.
Demand is not yet confirmed: The Week 43 update shows ETF outflows narrowing but still negative, and spot aggressive trading has not turned into net buying.
Key levels must be layered: Around $88,000 is prior holding-cost pressure, $80,000–$81,500 is a historical absorption observation band, and roughly $78,000 below that is a real market mean reference. These are coordinates from their respective data timestamps.
This week is not over yet; support, cost lines, and liquidation distribution will change, and old snapshots cannot be treated as fixed trading instructions.
01 In a Decline, First Look at Who Is Selling, Not Just How Much It Fell
Falling to the same price can still mean very different internal market states.
If every pullback brings more loss realization, it means holders under pressure are still increasing; if price repeatedly approaches the same area while loss realization does not expand in tandem, it is worth asking: have the people most eager to exit already thinned out?
In analyses on October 15 and 17, Murphy compared three pullbacks on October 9, 12, and 15: entity-adjusted realized losses were smaller in the second than the first, and higher in the third than the second but still below the first.
This is not “less every time,” but it shows that the third shock did not trigger greater loss realization than the first. It supports the explanation that seller pressure has weakened somewhat, but is not enough on its own to confirm a bottom.
An earlier Glassnode report provided another clue: as of the October 13 observation, long-term holders’ realized losses had fallen by about 85% from the August 12 peak.
This refers to “weaker loss selling,” not that all old holders have stopped selling. Those with lower holding costs may still realize profits during rebounds.
Improvement in the supply structure is reflected in how the market absorbs selling, not in the market having no selling at all.
Transfers to exchanges do not equal completed sales. Custody migrations, margin arrangements, and internal transfers can all affect the readings.
Figure 1 Long-term holder loss realization declines
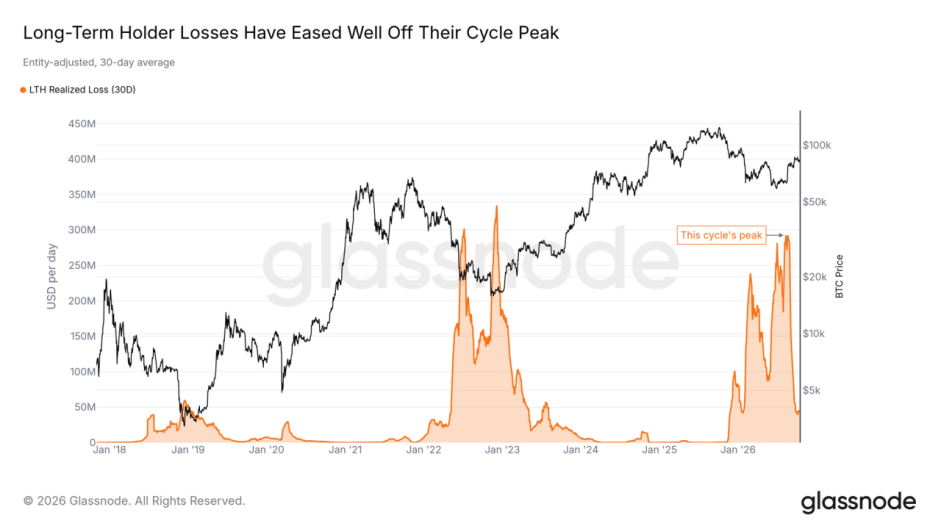
Orange is entity-adjusted long-term holder realized losses, using a 30-day average; the black line is BTC price. This chart shows long-term changes, not an hour-level comparison of the three pullbacks. Source: Glassnode, extracted from the local “1018 Boxed In.” On-chain data as of October 13, 2026; used for structural background, not a real-time update on October 21.
02 Some Are Buying, But Not Everyone Is Buying Together
This adjustment has not only involved exits; positions have also been increasing.
According to the First Buyers indicator in Murphy’s compiled notes, as of October 11, new buyers in this cycle held about 4.27 million BTC, an increase of about 400,000 BTC from before the August rally began.
This indicator shows that, under the corresponding classification method, more coins have entered new buyers’ holdings. But it is not the number of independent buyers, nor can it be directly multiplied by the current price as a precise measure of new cash inflows.
The October 19 analysis then shifted the lens to groups of different holding sizes: the 100–1,000 BTC group showed absorption near about $81,000, while the 1–10 BTC group has recently tended to sell, with most other groups relatively neutral.
This divergence aptly describes the current situation: some participants find the price attractive, others choose to realize gains, and more are still waiting.
We also cannot conclude solely from holding size that a given group must be funds, institutions, or retail. Wallet groupings and real investor identities are not one-to-one.
Having some absorption can slow pullbacks; only broader buying participation can improve the sustainability of a breakout.
This also explains a seemingly contradictory phenomenon: new buyers’ holdings are increasing, so why does the market still feel short of money?
Because position accumulation over a period and whether anyone is continuously bidding prices higher right now measure different things. The former reflects where coins are going; the latter more directly affects short-term prices.
03 What’s Really Missing Is Sustained New Buying Through Actual Trades
Whether demand has returned requires looking at capital flows and actual trading.
Glassnode’s Week 43 update published on October 19 showed: for the week ended October 18, weekly net ETF outflows narrowed from about $675 million to $230 million; spot CVD remained negative at about −$83.6 million.[1]
Reduced outflows are worth noting, but the direction of capital flows has not turned positive. Spot CVD measures the cumulative difference between aggressive buying and aggressive selling; a negative value also means aggressive selling still had the upper hand in the corresponding window.
This connects with the earlier process: from September 21 to October 6, U.S. spot ETFs had cumulative net inflows of nearly $3 billion; but as of the October 12 statistics, cumulative net outflows since October 7 had reached about $760 million.
The two figures belong to different time windows; cumulative outflows cannot be directly compared with single-week outflows, nor can both be called “this week’s outflows.”
Figure 2 ETF buying weakens again after returning
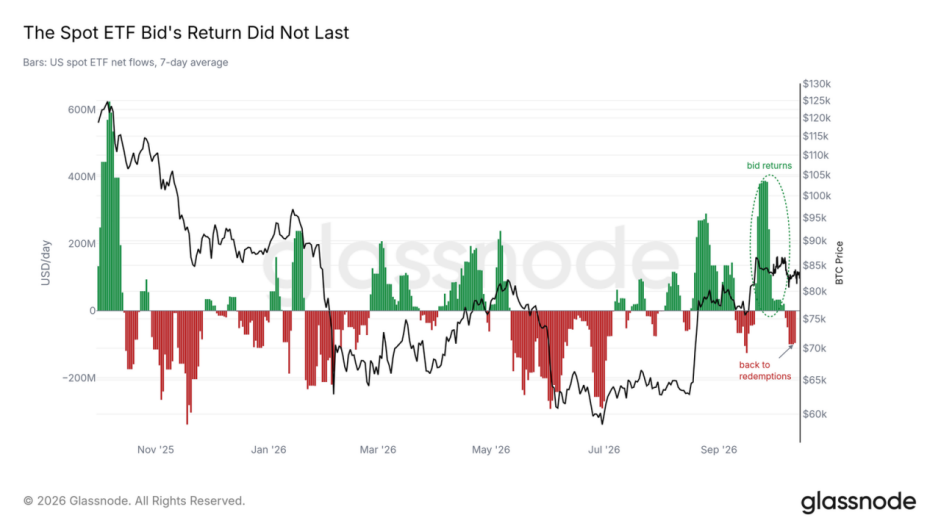
Bars are the 7-day average of U.S. spot ETF net flows; the black line is BTC price. This chart is not the weekly statistic for this week’s $230 million net outflow, and bar heights cannot be directly compared with weekly cumulative values. Source: Glassnode, extracted from the local “1018 Boxed In.” ETF flows as of October 12, 2026; used for structural background, not a real-time update on October 21.
Trading volume also provides context. In earlier statistics through October 6, spot exchanges and U.S. spot ETFs combined had a seven-day average daily volume of about $6.8 billion, still below about 90% of trading days since January 2024.
This is not this week’s volume reading, but it helps explain why previous breakouts tended to reverse: price briefly crossing resistance does not mean participation scale has recovered.
Next, more meaningful than how much flows in on any single day is whether net inflows persist across multiple trading days, whether volume becomes active in tandem as price rises, and whether there is still absorption after pullbacks.
Sellers stepping back and buyers actively stepping forward do not mean the same thing for price.
04 $80,000 Is Defended—Why Is $88,000 So Hard to Pass
Sideways trading is hard to endure often because above and below the price, there are groups of people with different reasons.
In the mid-October snapshot corresponding to “Boxed In,” the cost basis of the group that bought 6–12 months ago was about $88,000, while the cost basis of the group that bought 1–2 years ago was close to $100,000.
For some who entered at higher levels, a rebound approaching their cost may present an opportunity to reduce losses or exit. Therefore, overhead pressure comes not only from horizontal lines on the chart, but also from holders’ willingness to exit.
But cost lines represent the average state of a group and cannot be used to infer that every holder will sell at the same level.
Figure 3 High-level buyers’ costs create overhead pressure
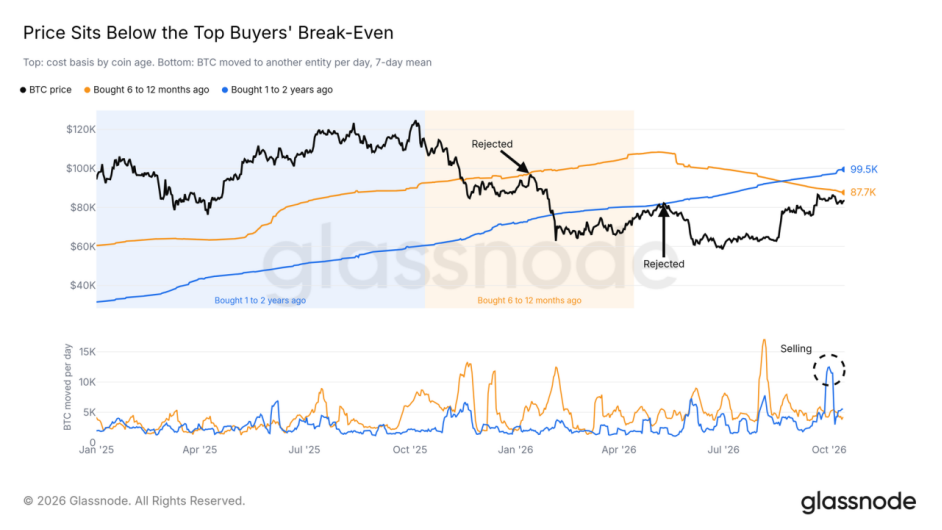
The orange line is the 6–12 month holding cost, and the blue line is the 1–2 year holding cost; the end values in the chart are about $87,700 and $99,500, respectively; the lower panel shows on-chain transfer activity for the corresponding groups. The main text uses rounded expressions of about $88,000 and $100,000. Source: Glassnode, extracted from the local “1018 Boxed In.” On-chain data as of October 13, 2026; used for structural background, not a real-time update on October 21.
Below, there is another set of coordinates: in the same report, the U.S. spot ETF cost was about $81,500, and the real market mean was about $78,000.
These are cost estimates under different models, not buy orders committed to holding. In particular, the ETF cost indicator cannot simply be understood as the actual purchase price of every fund unit holder.
On October 14, Murphy mentioned that short-term holder cost was about $74,500 and the real market mean was about $77,500. It is close to the report’s roughly $78,000, but the update time and calculation basis still need to be kept separate.
Short-term holder cost moving up toward the real market mean indicates that recent trading is gradually reshaping the cost structure. But extrapolating from a certain month’s growth rate is not enough to determine when the two lines will cross, let alone provide a “last boarding deadline.”
Cost structure can help understand holders’ situations, but it will not book a breakout date for the market.
Figure 4 Price and its position relative to three cost lines
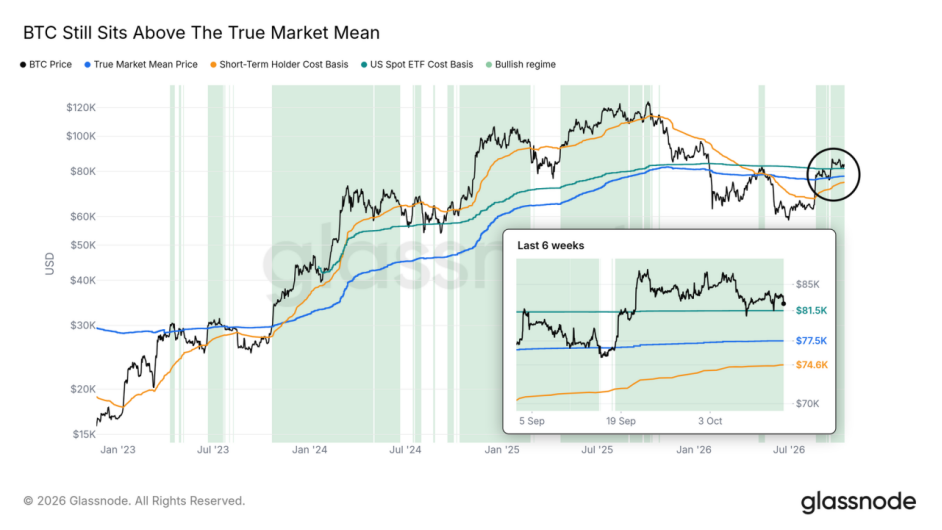
Cyan is ETF cost, blue is real market mean, and orange is short-term holder cost. The end values in the chart are about $81,500, $77,500, and $74,600; the roughly $78,000 in the main text is a rounded expression and does not mean the indicator is fixed. Source: Glassnode, extracted from the local “1018 Boxed In.” On-chain data as of October 13, 2026; used for structural background, not a real-time update on October 21.
05 On-Chain Recovery Does Not Mean Short-Term Volatility Is Over
In the October 21 compiled notes, Murphy compared the 30-day moving average of entity-adjusted transfer volume with the 365-day moving average and interpreted the related signal as on-chain activity moving toward recovery.[2]
This perspective is worth tracking: after filtering out transfers within the same entity, medium- and long-term changes in settlement activity are closer to a sustainability observation than a single “whale transfer.”
However, the compiled notes did not embed the original chart from that tweet, nor did they provide a complete indicator series. Therefore, this article treats it as the analyst’s latest observation and does not upgrade it to a trend conclusion that has been independently recalculated.
Even if on-chain activity improves, it does not mean new capital will necessarily buy BTC; the direction of settlement volume and exchange net buying can naturally differ.
In the short term, leverage and order books also need attention.
An earlier snapshot as of October 14 showed that Binance’s largest buy-order zone had moved down from about $81,000 previously to about $80,000; the corresponding liquidation model showed relatively obvious clusters of positions slightly below $80,000 and near $88,000.
Figure 5 Order book absorption zone shifts down to around $80,000
The bright horizontal bands represent areas with denser Binance BTC/USDT spot orders. The $80,000 buy orders in the chart belong to the snapshot at that time; orders may be canceled or consumed. Source: Glassnode, extracted from the local “1018 Boxed In.” Order book and hourly prices as of October 14, 2026; used for structural background, not a real-time update on October 21.
If support is lost, forced liquidation of leveraged longs may amplify the decline; if the upside touches dense short zones, it may also briefly accelerate gains. Neither automatically indicates that spot demand has improved.
Orders can be canceled, and liquidation heatmaps are model estimates. Old charts show where fragility was at the time, not a route that must be triggered today.
The earlier reminder about locally elevated leverage in altcoins should likewise be understood in the risk context. Without updated data for this week, we do not write it as a fact that current market-wide leverage continues to climb, nor do we infer from two historical cases that ETH/BTC must rotate.
06 Next, Which Pieces of Evidence to Wait For
Putting this information together, the more appropriate judgment now is: coins are digesting selling, and demand still needs confirmation. Between temporary price stability and a trend already underway, more evidence is needed.
The first change is demand truly connecting.
Watch whether ETFs move from narrowing outflows to consecutive net inflows, whether spot aggressive trading strengthens, and whether trading can be retained at higher levels after a rise. If these changes are accompanied by price digesting the prior cost pressure around $88,000, a breakout would have more structural support.
The second change is continued digestion through time.
If selling pressure does not expand and buying does not increase noticeably, range-bound repetition may continue. At this point, the most valuable thing is not to find an explanation for every candlestick, but to track whether cost lines, capital flows, and where coins are going continue to improve.
The third change is absorption beginning to fail.
If, in updated order books, existing buy orders retreat or are continuously consumed, price loses the corresponding cost area, and ETF outflows and aggressive selling strengthen again at the same time, then the assessment of structural resilience needs to be lowered. The roughly $78,000 level is only the next reference from before; it cannot be used to conclude that a decline to that level would stop there.
The price coordinates here come from mid-October materials, not the real-time order book on October 21; actual tracking should replace them with the latest readings. The meaning of observation conditions is to allow judgments to be revised by evidence.
Final Thoughts
The longer the market stays in a range, the more it makes people eager to find a definitive sentence.
But the most valuable part of this batch of materials is precisely that it helps us separate several questions: has loss selling weakened, has new buying returned, and can price stay in a new trading range.
The first question is showing signs of improvement; the latter two still need the market to keep answering.
Lighter selling pressure is progress; sustained demand接力 is the more solid basis for leaving the range.
Next, rather than redoing a bull/bear judgment every day, it is better to consistently record multi-day ETF flows, spot aggressive trading, and reactions after key areas are tested. Let every judgment clearly state what the basis is and what changes would make you revise your view.
Data and Sources
[1] Glassnode, BTC Market Pulse: Week 43, published October 19, 2026, with charts covering the week ended October 18. Used for this article’s latest weekly demand observation: https://research.glassnode.com/btc-market-pulse-week-43-2026/
[2] Murphy’s views are mainly taken from content on October 13, 14, 15, 17, 19, and 21. Original tweet link for October 21: https://x.com/Murphychen888/status/2112754773539864921 . The original tweet page could not be read directly this time; related views are paraphrased according to the compiled notes and were not independently recalculated.
[3] Glassnode, “Boxed In,” official publication date October 14, 2026. Daily on-chain indicators as of October 13, ETF flows as of October 12, hourly prices, liquidations, and order books as of October 14: https://research.glassnode.com/the-week-onchain-week-41-2026/
[4] Glassnode, “A Rally Running Light,” official publication date October 7, 2026. On-chain and new capital data as of October 5, trading volume as of October 6, hourly indicators as of October 7. This article uses it only for background explanation: https://research.glassnode.com/the-week-onchain-week-40-2026/
This article is an interim data analysis as of October 21, 2026, not a complete weekly close review, and does not include real-time market quotes. Charts retain their original sources and timestamps; analytical judgments are comprehensive interpretations and do not constitute investment advice.